


From time to time, we take a step back and look at the BIG picture…the macro view. In this brief analysis, we look at the US equity market valuations using several popular indicators.
What We Measure
We track valuation the way we track anything else that matters to long-term outcomes: with more than one lens, because any single measure can mislead on its own. Here, we look at the total value of U.S. equities relative to 1) the size of the economy, 2) the price relative to a smoothed measure of corporate earnings, and 3) where prices sit relative to their own longer-term trend. Individually, each of these has flaws. Together, they tend to agree with one another at the moments that matter most.
Right now, they agree. 1All three measures sit at or near the richest readings we have observed in the roughly thirty-six years of data we reviewed. That is not a forecast of what happens next. It is a description of where we are.
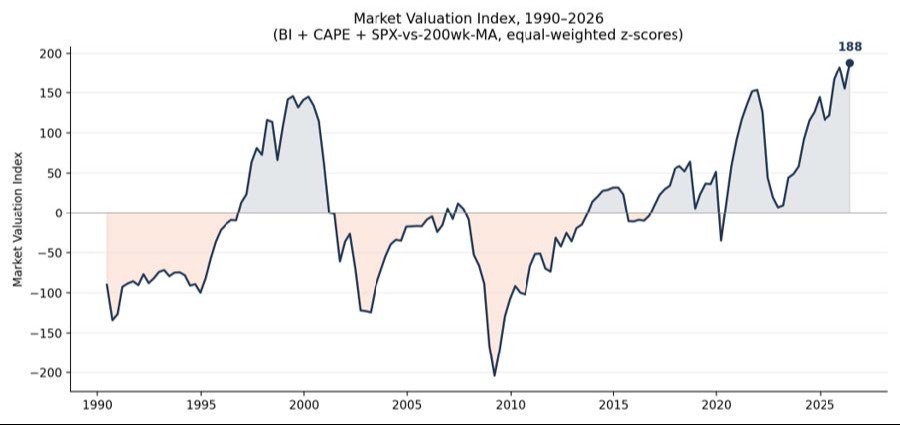
Composite valuation reading, equal-weighted across all three measures, 1990–present. Zero represents the long-term average. Source: Bloomberg L.P.; Robert J. Shiller Online Data; U.S. Bureau of Economic Analysis; S&P Dow Jones Indices. Composite index and normalization calculations by Van Hulzen Asset Management.
2The chart above is the clearest way we know to show this. It combines the three measures into a single reading, scaled so that zero represents the long-term average and each unit reflects how far current conditions sit from that average, in comparable terms across all three inputs. The current reading is the highest point on the entire chart, higher than the readings that preceded the two most significant equity drawdowns of the past two decades, and part of a cluster of similarly extreme readings that has built over the past year and a half.
We would draw two observations from the shape of this history rather than the level alone. First, extreme readings have not resolved quickly in the past; the chart shows extended stretches at elevated levels before conditions eventually normalized, which argues against using this as a short-term trading signal. Second, every prior visit to the upper end of this range was eventually followed by a return toward or through the average. The readings we have on file simply do not stay this stretched indefinitely. We do not know which of those two features will dominate over the next year. We think clients should be aware of both.
Two Ways Back to Normal
Valuation measures do not stay stretched forever. History suggests they return toward their long-term averages one of two ways: a decline in price, or the passage of time during which earnings and economic growth catch up to where prices already are. Most real episodes are some blend of the two.
We modeled this directly.3 If prices were to move sideways from here — essentially flat, with no further gains and no decline — it would take on the order of 7 years of trend earnings and economic growth to bring valuations back to their historical average. At the other extreme, a decline on the order of -30%, absorbed all at once, would accomplish the same normalization immediately. Every combination in between is a genuine substitute for every other: a milder decline paired with several more years of patience arrives at the same destination as a sharper decline that resolves quickly.
We want to be precise about what this exercise is and is not. It is not a prediction that either outcome is coming, nor an estimate of which is more likely. It is arithmetic, a description of the distance between where valuations sit today and where they have historically averaged, expressed in the two currencies that can close that distance: price and time.
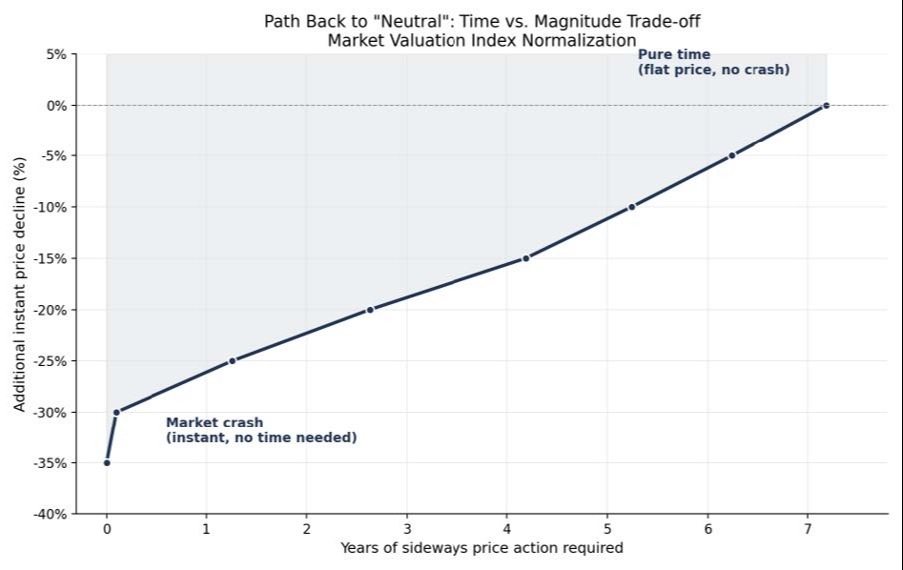
Each point on the curve is a mathematically equivalent path back to the long-term average. Source: Van Hulzen Asset Management calculations using Bloomberg historical market data and long-term earnings/GDP assumptions.
What This Means in Practice
A few observations we think are useful for our conversations, stated plainly:
Elevated valuations have historically told us very little about what happens over the next three, six, or twelve months.4 Expensive markets have gone on to become more expensive for extended periods before anything changed. Valuation is a poor timing tool and always has been.
What elevated valuations have told us, with more consistency, is something about the range of outcomes to expect over longer horizons and about the depth of drawdown that has historically accompanied the eventual correction when one arrives. This is less a warning to act than a reason to make sure portfolios are positioned for a wider range of outcomes than the recent past alone would suggest.
The most likely path, if history is a guide, is neither of the two extremes we modeled. Markets rarely move in a straight line in either direction. Some combination of a moderate pullback and several years of digestion is the more common pattern than either a swift, complete reset or an uninterrupted seven-year plateau.
Where This Leaves Us
We are not forecasting a decline, and we are not advising clients to exit equity markets on the basis of valuation alone; that is a strategy that has a poor track record of its own. What we are doing is what we always try to do: naming the environment honestly, sizing risk accordingly, and making sure that when the eventual reversion happens, in whatever combination of price and time it takes, it arrives as a known possibility rather than a surprise.
We would rather have this conversation with you now, in plain terms, than explain it after the fact. We remain available to walk through what this means for your specific portfolio and time horizon.
*The foregoing content reflects the opinions of Van Hulzen Asset Management DBA "Van Hulzen Financial Advisors" and is subject to change at any time without notice. Content provided herein is for informational purposes only and should not be used or construed as investment advice or a recommendation regarding the purchase or sale of any security. There is no guarantee that the statements, opinions or forecasts provided herein will prove to be correct. Past performance may not be indicative of future results. Indices are not available for direct investment. Any investor who attempts to mimic the performance of an indexwould incur fees and expenses which would reduce returns. Securities investing involves risk, including the potential for loss of principal. There is no assurance that any invest-ment plan or strategy will be successful. Van Hulzen Asset Management is an investment advisory firm registered with the Securities and Exchange Commission (“SEC”). SEC registration does not imply a certain level of skill and/or expertise. VanHulzen Asset Management does not provide tax advice; please consult your tax professional for any specific tax-related questions.
Selected Sources and Methodology
¹ Market Valuation Framework
Market valuation observations and historical comparisons are based on data obtained from Bloomberg L.P., Robert J. Shiller Online Data, S&P Dow Jones Indices, and the U.S. Bureau of Economic Analysis (BEA). Composite valuation calculations were developed and performed by Van Hulzen Asset Management.
² Valuation Normalization Model
The valuation normalization analysis presented in this commentary—including the hypothetical scenarios illustrating approximately seven years of trend earnings and economic growth or an immediate market decline sufficient to return valuations to long-term averages—represents proprietary analysis performed by Van Hulzen Asset Management using Bloomberg L.P. historical market data, Robert J. Shiller CAPE data, and U.S. Bureau of Economic Analysis nominal GDP data.
This analysis is intended to illustrate mathematically equivalent paths by which valuations could historically return to long-term averages and should not be interpreted as a forecast or prediction.
³ Long-Term Valuation Research
Historical observations regarding valuation, expected long-term returns, and market mean reversion are supported by decades of published research, including:
•Robert J. Shiller, Irrational Exuberance (3rd Edition)
•Research Affiliates – Expected Returns Research
•GMO – Asset Allocation and Long-Term Valuation Research
•AQR Capital Management – Research on Valuation and Market Timing
These studies consistently conclude that valuation metrics have historically demonstrated limited predictive power over short investment hori-zons while providing more meaningful information regarding long-term expected returns and risk.
⁴ Historical Market Data
Historical market prices, valuation measures, index levels, and related calculations are based primarily on Bloomberg L.P. historical market data together with Robert J. Shiller Online Data, S&P Dow Jones Indices, and U.S. Bureau of Economic Analysis data where applicable.
Chart Sources
Composite Valuation Reading (Page 1)
Source: Bloomberg L.P.; Robert J. Shiller Online Data; U.S. Bureau of Economic Analysis; S&P Dow Jones Indices. Composite index methodology and normalization calculations by Van Hulzen Asset Management.
Valuation Normalization Analysis (Page 2)
Source: Van Hulzen Asset Management calculations using Bloomberg L.P. historical market data, Robert J. Shiller CAPE data, U.S. Bureau of Eco-nomic Analysis nominal GDP data, and long-term earnings growth assumptions.